
What is a linear inequality? Think of a linear equation, see the article here, but instead of an equal sign, you have > (more than), < (less than), ≥ (more or equal to) or ≤ (less than or equal to) sign. The best way to show what inequality is and what it means is to go through an example.
Example
Let’s consider a simple inequality
y > x+1
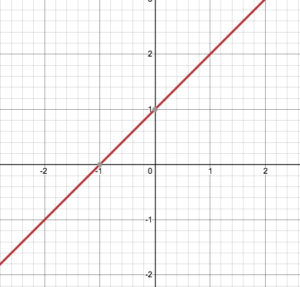 First, let’s change the inequality into a linear equation. To do that, you just need to change “>” sign to “=” sign, so the expression turns into the expression of a linear equation y=x+1. [If you need to refresh yourself on how to graph a linear equation, click here.]
Once we graph the line, we change the sign back to “>” and turn the expression to inequality, y>x+1.
Since y is greater than x+1, the shaded part is above the line. y gets bigger as y-axis goes up, so it makes sense that the shaded part is above the line. 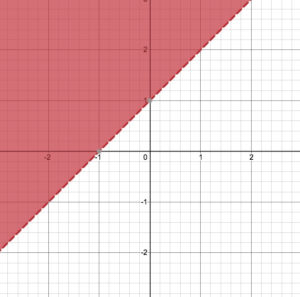
If the equation were y<x+1, then the shaded part would be below the line, since moving down along y-axis indicates that y is decreasing.
Also notice that the line is dotted, indicating that any values that are on the line itself are excluded, since the sign of the inequality is > (greater than).
If the sign were ≥ (greater than or equal to), then the line would be solid, indicating that the values along the line are also included in the inequality.
So what does this inequality indicate?
It shows that the expression works for any values of y above the line, but not including the values on the line. And that the expression doesn’t work for any values of y on the line and below.
Practice Problems
Graph the following inequalities:
y > 2x – 1
y ≤ -x – 2
y ≥ 0.5 x – 4